Applies To: ThreatSync
Some of the features described in this topic are only available to participants in the ThreatSync Beta program. If a feature described in this topic is not available in your version of WatchGuard Cloud, it is a beta-only feature.
An incident is activity that is confirmed to be malicious. An incident can be as simple as an indicator of compromise, or as complex as an indicator of attack that sequences behaviors to determine malicious intent.
The Incidents page provides a centralized list of incidents for Incident Responders to review and perform actions on. Every incident listed on the page is actionable.
On the Incidents page, you can:
- Change the Date Range
- Sort and Filter the Incident List
- View Incident Charts
- Download the Incident List Report
- Remote Control (Windows Computers)
For more information on incidents, go to Review Incident Details. For more information on how to perform actions on an incident, go to Perform Actions on Incidents and Endpoints.
To open the ThreatSync incident list:
- Select Monitor > Threats > Incidents.
The Incidents page opens.

- To view specific incidents on the page:
- To view more detailed information for a specific incident in the Incident Details page, click the incident. Tip! For more information, go to Review Incident Details.
You can perform actions on incidents directly from the Incidents page. For more information, go to Perform Actions on Incidents and Endpoints.
Change the Date Range
By default, the incident list shows incidents that occurred on the current date. You can change the date range to view incidents from different dates.
To filter the incident list by date range:
- On the upper part of the page, click
 .
. - From the drop-down list, select from these time periods:
- Today
- Yesterday
- Last 24 Hours
- Last 7 Days
- Last 14 Days
- This Month
- Last Month
- Custom
- If you select Custom, specify a start and end date for the custom time period. Click Save.
Sort and Filter the Incident List
By default, the incident list shows incidents with a status of New and Read, sorted by risk level in descending order, so the most critical threats are at the beginning of the list.
To customize which incidents you view, you can filter the incident list by incident type, action, risk, or status. You can also choose to sort the list by risk level or date.
To sort the incident list:
- In the upper-right of the page, click
 .
.
A drop-down list opens.
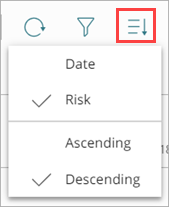
- Select whether to sort incidents by date or risk level, in ascending or descending order.
To filter the incident list:
- In the upper-right of the page, click
 .
.
The Filter dialog box opens.
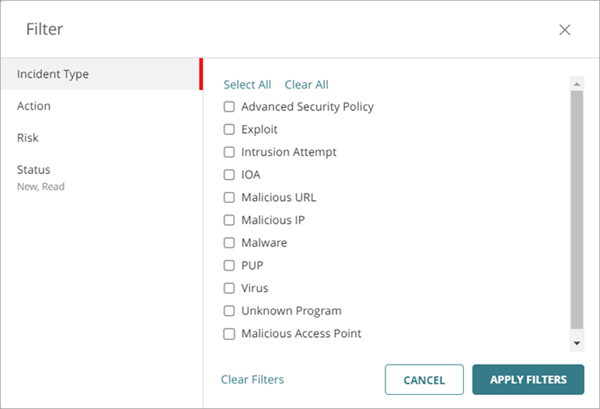
- Select one or more filter options:
- Click Apply Filters.
Incident Type
To filter the incident list by Incident Type, select one or more of these options:
- Advanced Security Policy — The execution of malicious scripts and unknown programs that use advanced infection techniques.
- Exploit — Attacks that try to inject malicious code to exploit vulnerable processes.
- Intrusion Attempt — A security event where an intruder tries to gain unauthorized access to a system.
- IOA — Indicators of Attack (IOAs) are indicators that are highly likely to be an attack.
- Malicious URL — A URL created to distribute malware, such as ransomware.
- Malicious IP — An IP address associated with malicious activity.
- Malware — Malicious software designed to damage, disrupt, and gain unauthorized access to computer systems.
- PUP — Potentially Unwanted Programs (PUPs) that might install when other software installs on a computer.
- Virus — Malicious code that enters computer systems.
- Unknown Program — Program was blocked because it has not yet been classified by WatchGuard Endpoint Security.
- Malicious Access Point — An unauthorized wireless access point connected to your network or operating in your airspace.
Action
To filter the incident list by action performed on the incident, select one or more of these check boxes:
- Allowed (Audit Mode) — Incident detected, but because the device is in Audit mode, no action was taken.
- Connection Blocked — Connection blocked.
- Process Blocked — Process blocked by an endpoint device.
- Device Isolated — Communication with device is blocked.
- File Deleted — File was classified as malware and deleted.
- IP Blocked — Network connections to and from this IP address are blocked.
- Process Killed — Process ended by an endpoint device.
- Detected — Incident detected but no action was taken.
To filter the incident list by action status, select one or more of these check boxes:
- Performed — Requested action is complete.
- Performing — Requested action is in progress.
- Not Performed — Requested action has not yet been performed.
- Error — Requested action did not complete and returned an error. For more information, go to Troubleshoot Incident Errors.
Risk
To filter the incident list by risk level, select one or more of these options:
- 10 — Critical
- 9 — Critical
- 8 — High
- 7 — High
- 6 — Medium
- 5 — Medium
- 4 — Medium
- 3 — Low
- 2 — Low
- 1 — Low
For more information, go to ThreatSync Risk Levels and Scores.
Status
By default, the incident list shows incidents with a status of New and Read. To filter the incident list by status, select one or more of these options:
- New — New incidents not yet reviewed in the Incident Details page.
- Read — Incidents reviewed in the Incident Details page or manually marked as Read.
- Archived — Incidents archived by an automation policy or manually archived because an analyst determined that the threat is no longer a concern.
For information on how to archive or change the status of an incident, go to Archive or Change the Status of Incidents.
View Incident Charts
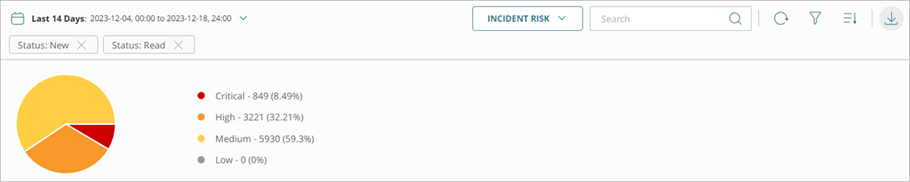
Charts are available to view on the Incidents page from the View Chart drop-down list. Each chart includes data from the specified date range.
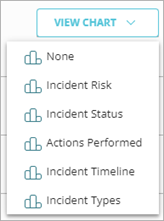
- Incident Risk — Shows a pie chart of Low, Medium, High, and Critical risk incidents.
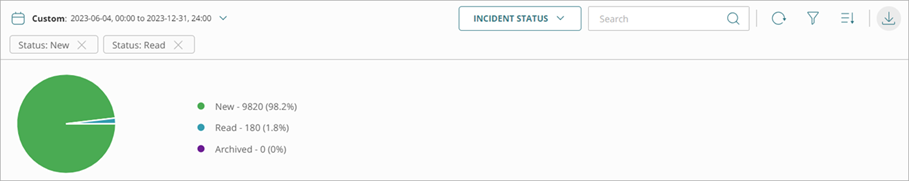
- Incident Status — Shows a pie chart of New, Read, and Archived incidents.
- Actions Performed — Shows a graph of actions performed on the incidents.

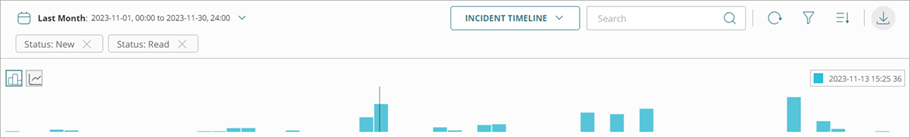
- Incident Timeline — Shows either a bar chart or line chart timeline of incidents. Hover over data in the chart to view the date and time of the incident.
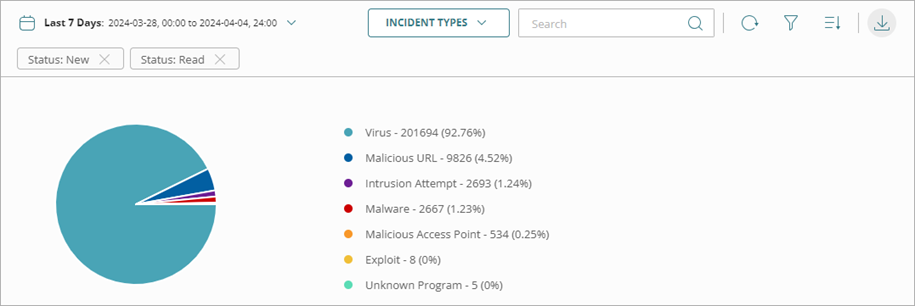
- Incident Types — Shows a pie chart of the types of incidents.
Download the Incident List Report
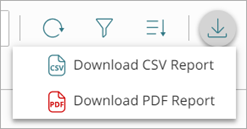
You can download an Incident List report in either CSV or PDF format on the Incidents page. The reports show incident data filtered according to your sort and filter options for the specified time period.
If you select a chart to view from the View Chart drop-down list, the selected chart also shows in the PDF Incident List report. If you do not want charts in your PDF report, select None from the View Chart drop-down list.
To download an Incident List report, click ![]() and select Download CSV Report or Download PDF Report.
and select Download CSV Report or Download PDF Report.
The PDF report provides details about incidents for your selected date range with your applied filters for incident type, action, risk, or status.
When you download a report from the Incidents page, you can choose to include only the first 10,000 incidents or all incidents in the report. When you include only the first 10,000 incidents, the report generates and downloads immediately. When you include all incidents, the report generates in the background and a notification prompts you to download the report when it is ready.
To download the Threats Summary Report, go to ThreatSync Incident Summary.
To schedule a ThreatSync report, go to Schedule ThreatSync Reports in WatchGuard Cloud.
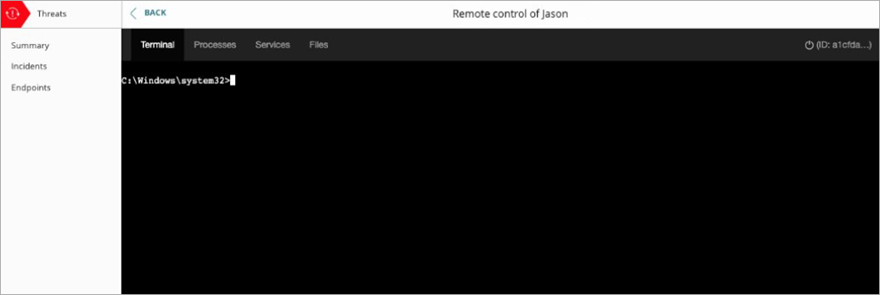
Remote Control (Windows Computers)
With the remote control tool, you can remotely connect to the Windows computers on your network to investigate and remediate potential attacks.
To use this feature, your remote Windows computers must have:
- An active WatchGuard Advanced EPDR license
- A remote control settings profile assigned in Endpoint Security. For more information, go to Configure Remote Control Settings (Windows Computers).
For more information, go to About the Remote Control Tool (Windows Computers) in the Endpoint Security Help.
To start a remote control session, from the Incidents page:
- Select the check box next to an incident.
The Actions menu appears. - From the Actions drop-down list, select Remote Control.
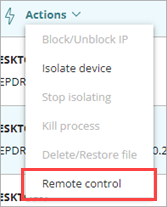
- Select Remote Control.
The Remote Control window for the computer opens.